VXsz
October 26, 2020, 3:21pm
1
So I tried putting a chart but it shows up blank, even when I used the wiki example (and added button for it) it seems to still be on blank (nothing ever shows up)
What I’m trying to use is making a chart for the recent exchange history for 2 currencies in price ($ to <another_currency>)
ghenne
October 26, 2020, 6:12pm
2
Are there any messages in the Chrome Console?
VXsz
October 26, 2020, 6:19pm
3
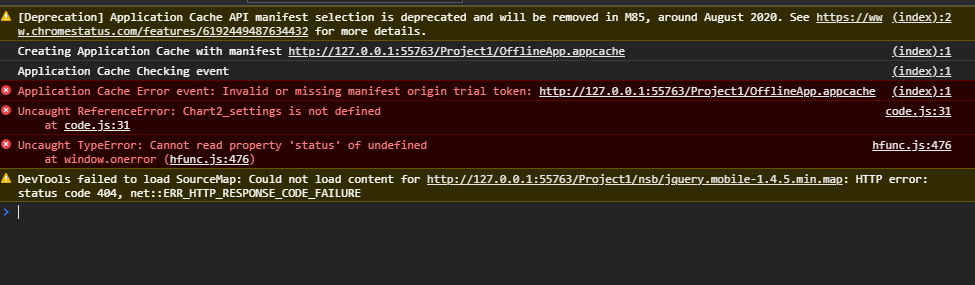
The following shows:
Mainly the the uncaught errors show up when using the chart, they don’t show up when removing them with their script
ghenne
October 26, 2020, 6:38pm
4
The Chart2_settings message is the important one here.
Have you tried the Chart sample? It works properly for me.
What version of AppStudio are you using?
VXsz
October 26, 2020, 6:40pm
5
It’s running on 6.2.6.4
ghenne
October 26, 2020, 7:01pm
6
That’s a very old version. Where is your school?
VXsz
October 26, 2020, 7:04pm
7
I’ve downloaded the latest 8.4.0.0 version, still the same problem, it even tells me with a pop up “Chart2_settings is not defined.”
As to the school, I prefer not to say that unless necessary
VXsz
October 26, 2020, 7:08pm
9
Yes, this is the code I used:
Dim sampleData, row

Function Button1_onclick()
  'Render the chart.
  $("#Chart1").jqxChart(Chart1_settings)
End Function

Function Form1_onshow()
  sampleData = []
  For i=0 To 6
    row=[]
    row["id"] = "Preise"
    row["Preis1"] = 25
    row["Preis2"] = 30
    row["Preis3"] = 35
    sampleData[i]= row
  Next

  Chart1_settings.source = sampleData
  Chart1_settings.categoryAxis={dataField:"id", showGridLines:True}
  Chart1_settings.seriesGroups = [ _
    { _
    type: "column", _
    columnsGapPercent: 30, _
    seriesGapPercent: 0, _
          valueAxis: _
          { _
          minValue: 0, _
          maxValue: 50, _
          unitInterval: 10, _
          description: "Preise in Euro(€)" _
          }, _
            series:[ _
                    { dataField: "Preis1", displayText: "Preis1"}, _
                    { dataField: "Preis2", displayText: "Preis2"}, _
                    { dataField: "Preis3", displayText: "Preis3"} _
                    ] _
    } _
    ]

End Function
I’ve changed it to BASIC just to be sure, and the I changed the Chart ID to Chart2