I am trying to put a plotly graph into a container (so I can put other things on the form below it). I added a Container control named myDiv to the form and use it for the graph. But appStudio doesn’t put the graph into the div. Here is the Javascript. Thoughts?
Form1.onshow=function(){
// default height and width: 350x700px
var graphDiv = 'myDiv'
var x = []
for (var i = 0; i < 500; i ++) {
x[i] = Math.random()
}
var trace = {
x: x,
type: 'histogram',
}
var data = [trace]
var layout = {
autosize: false,
width: 250,
height: 400,
margin: {
l: 50,
r: 50,
b: 100,
t: 100,
pad: 4
},
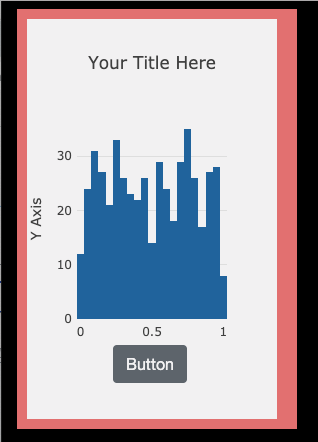
title: 'Your Title Here',
xaxis: {
title: 'Z Axis',
showgrid: false,
zeroline: false
},
yaxis: {
title: 'Y Axis',
showline: false
}
}
Plotly.newPlot(graphDiv, data, layout, {scrollZoom: true},{responsive: true})
}
Here is the project : PlotlyHistogramDemo.appstudio.zip (2.6 MB)